1. Clusters reduction
This project has been realised in Python.
From the computed dimensions of a set of people that took psychometric test, we clusterise those users according to some criteria.
Each cluster of people represents a profile defined by the centroid of the cluster (the mean) and its standard deviation. This project
illustrates the clusterisation of testees that have their dimensions computed. These algorithms then generate clusters according to some
parameters. The centroid and standard deviation are calculated for each profile.
Then a profile is attributed to each testee by calculating the distance to each cluster and then calculating a softmax to determine the maximal
probability: this defines the cluster to be attributed to the testee.
In this project the variables to be defined were the best number of clusters to generate and the definition of these clusters.
A cluster defines a typical profile.
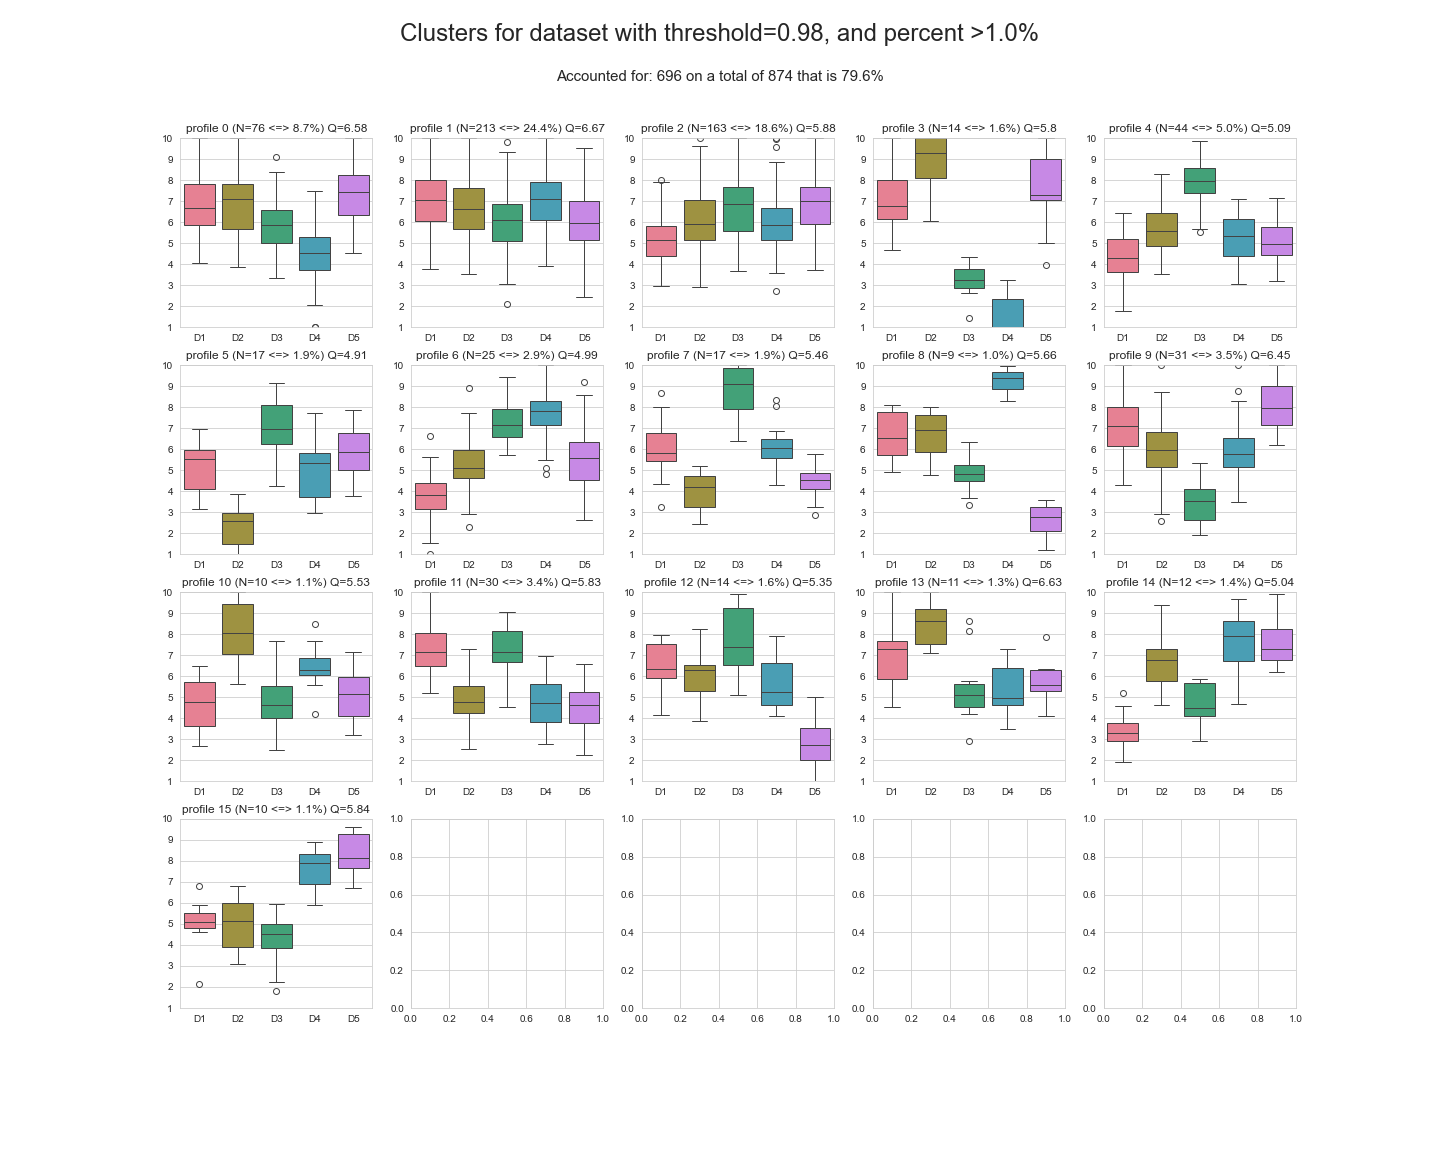
The next picture shows the profile definitons for the profiles most frequently found in the population.
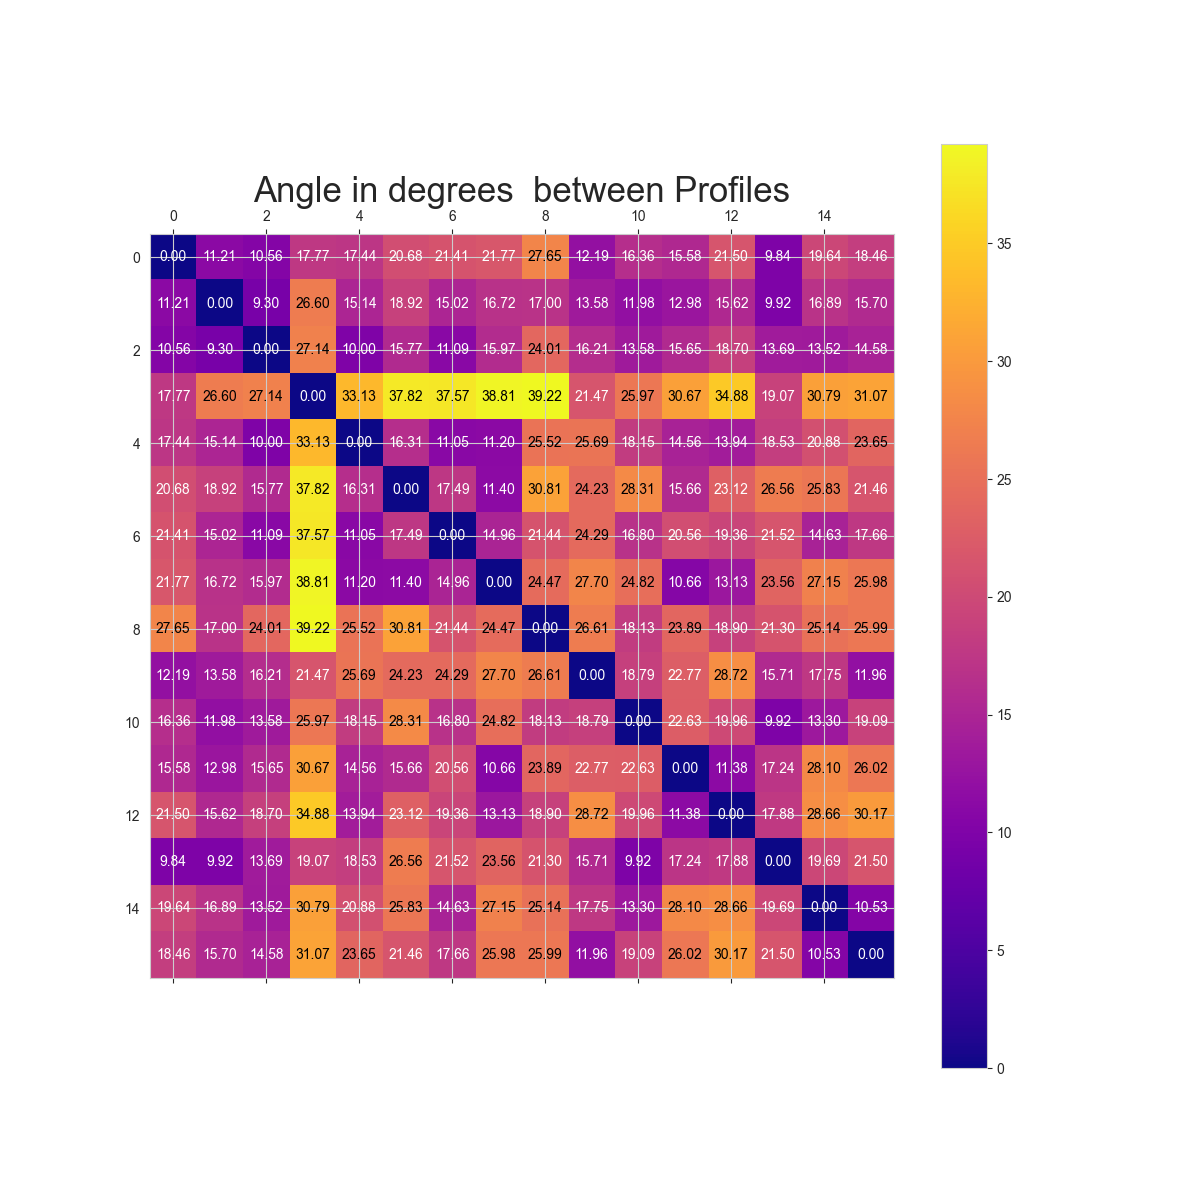
The next picture shows the separation between the various clusters.
2. Profile identification
Once the profiles have been defined it is possible to compare an individual to the profiles and define the best match. It is then possible to apply
a suitable treatment based on the profile.
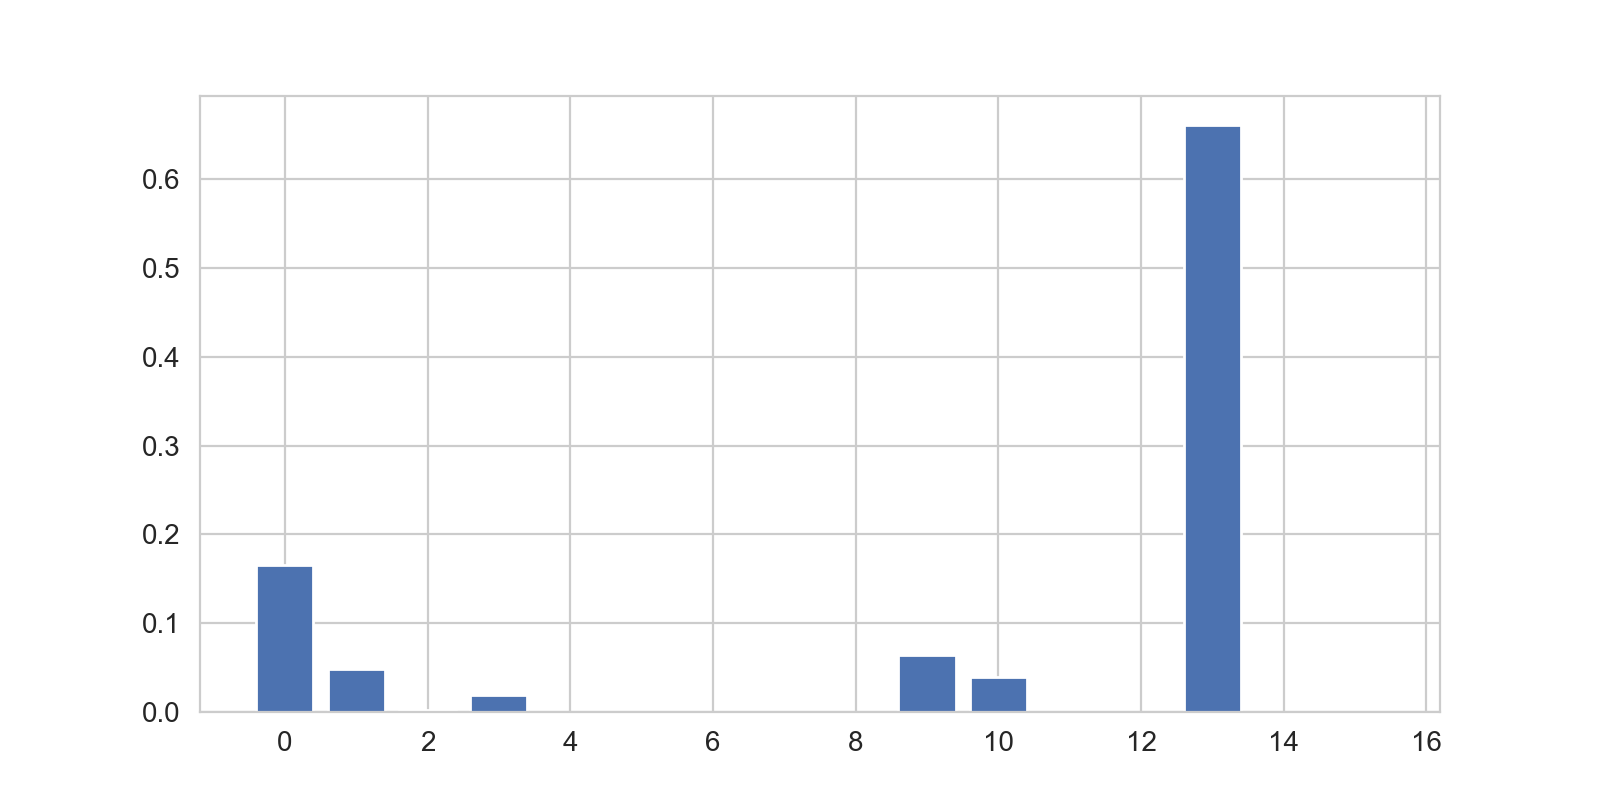
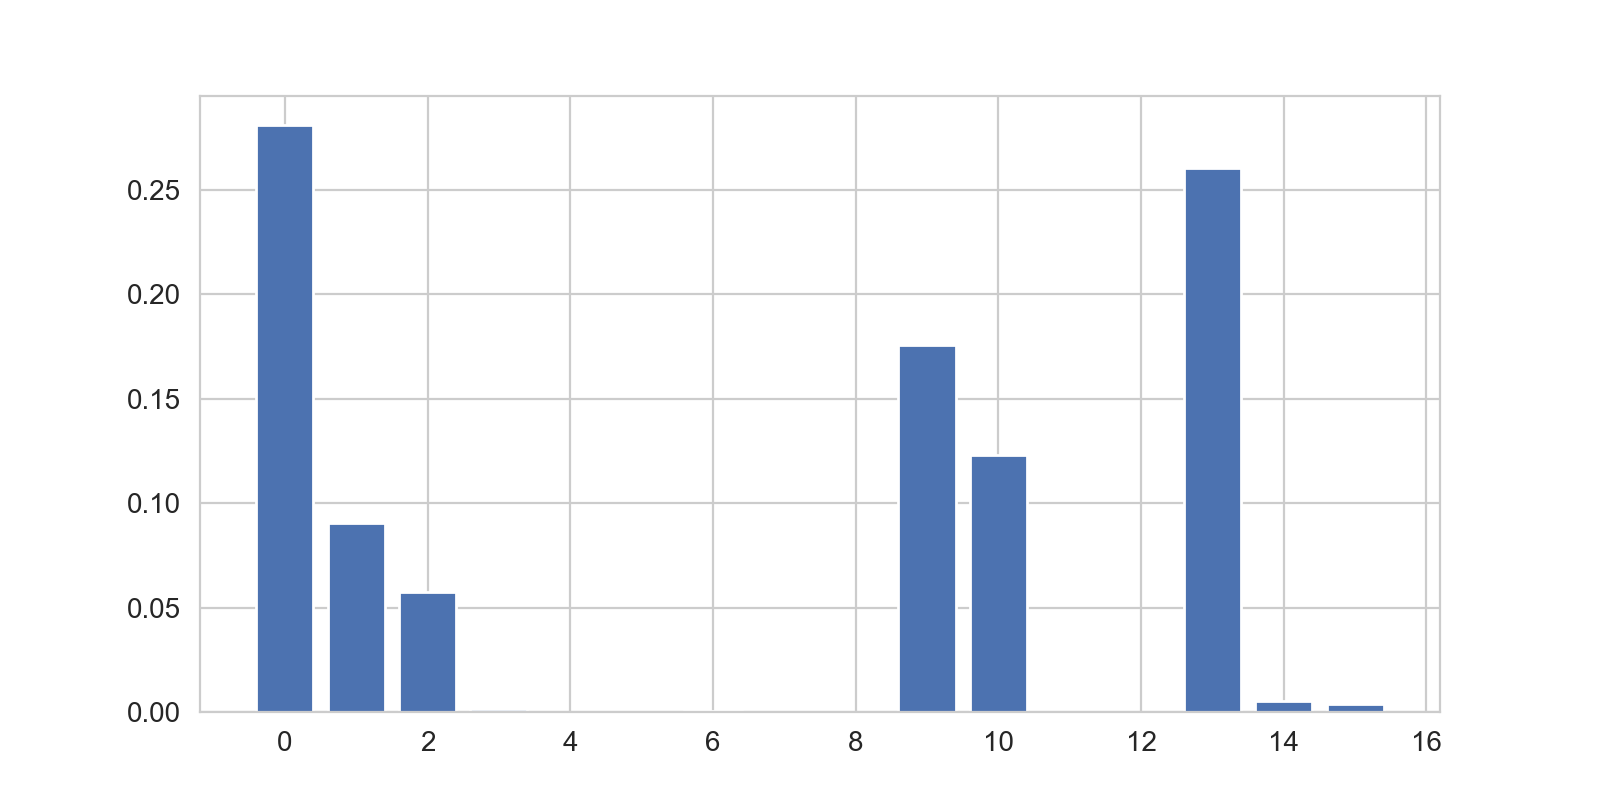
In the pictures below we show the match of two individuals with the various profiles, for which two different kind of actions will be provided.